The performance of the algorithms was evaluated against ground-based fire observation data obtained by provincial fire agencies in Saskatchewan and Manitoba. The test site, which is the study region of the Boreal Ecosystem-Atmosphere Study (BOREAS), spans an area of 1000 by 1000 km across the two provinces [3].
The hotspot algorithm was applied to archived single-date GEOCOMP composites for the years 1994-2000, producing a daily fire mask for all of Canada. Since 1998 summer the algorithm has been applied operationally. Images showing active fires and smoke were generated within 6-10 hours of satellite reception, integrated with fire behavior information into GIS system, and put on a web site for users of Canadian fire management agencies and media.
Comparing the 1994 and 1995 locations to provincial fire surveys, the algorithm was found to detect the vast majority (> 90%) of fires larger than 300 ha. Within individual burns, however, the distribution of hotspots is patchy due to limited satellite revisit frequency and obscuring by cloud (Fig. 2). Consequently, the cumulative area of all hotspot pixels detected during each summer was, on average, about 30% less than estimates based on traditional reconnaissance. To account for these missed burned patches, a novel burned area mapping technique was developed.
Forest Fires, 1999
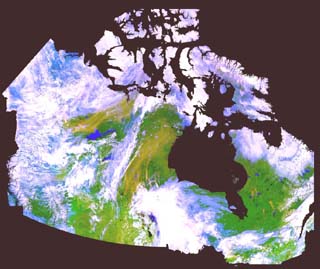
Given the size of Canada, the use of remote sensing data is considered to be the only cost effective way to achieve a comprehensive overview of forest fire activity in Canada in near-real time. These images were acquired as part of the Fire Monitoring, Mapping and Modeling System (Fire M3) an initiative of the Canada Centre for Remote Sensing and the Canadian Forest Service.
A dry spring and human carelessness has resulted
in more than 65 forest fires in Manitoba. About 400 residents of three
small towns clustered on the northeast shore of Lake Winnipeg have been
forced to flee their homes.
In Northern Ontario, 54 fires broke out over the
weekend of May 1, forcing for a time the closing of highways in the Temagami
and Kenora areas. A huge forest fire has forced the evacuation of the town
of Beardmore located on the southeast shore of Lake Nipigon. About 300
residents from the town have fled to Geraldton, 80 kilometres to the east.
Sources: Winnipeg Free Press and
CBC
News online.
Canadian Forest Fires, 1998
These are time series of NOAA AVHRR satellite images acquired over areas of Canada that clearly show the extent of forest fires. The hot spot of a fire is marked as a red dot and the backgroud is a false-color composite using AVHRR channel 1 (visible) and channel 2 (near IR) reflectance measurements.
AVHRR data are received at the Prince Albert satellite
receiving station. Raw data are sent to CCRS, where they are first calibrated.
A fire detection algorithm, developed by scientists in the Environmental
Monitoring Section is then applied, and the images can now be used by forest
fire management agencies for forest fire monitoring and supression.
![]() Kluane
Lake, Yukon
Kluane
Lake, Yukon
![]() Great
Bear Lake, NWT
Great
Bear Lake, NWT
![]() Great
Slave Lake, NWT
Great
Slave Lake, NWT
![]() Kasba
Lake, NWT
Kasba
Lake, NWT
![]() Salmon
Arm, B.C.
Salmon
Arm, B.C.
![]() Williston
Lake, B.C.
Williston
Lake, B.C.
![]() Swan
Hills, Alta.
Swan
Hills, Alta.
![]() Lake
Athabasca, Sask.
Lake
Athabasca, Sask.
![]() Reindeer
Lake, Sask.
Reindeer
Lake, Sask.
![]() S.
Indian Lake, Man.
S.
Indian Lake, Man.
![]() James
Bay, Ont.
James
Bay, Ont.
![]() Lake
Nipigon, Ont.
Lake
Nipigon, Ont.
![]() James
Bay, Que
James
Bay, Que
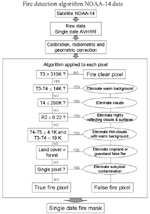
Figure 1.
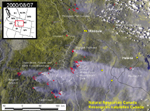
Figure 2.
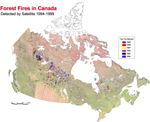
Figure 3.
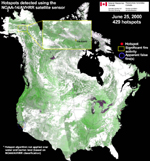
Figure 4.
Figure 5. 1994
Figure 6. 1995
Figure 7. 1996
Figure 8. 1997
Figure 9. 1998
Figure 10. 1999
Figure 11. 2000
Figure 12.
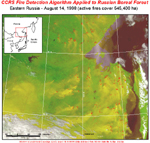
Figure 13.
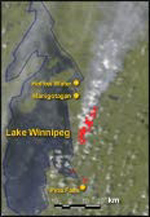
Figure 14.
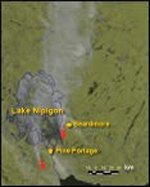
Figure 15.
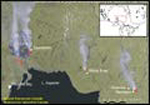
Figure 16.
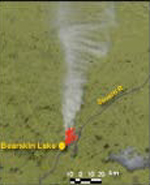
Figure 17.
Figure 18.